


Different particle measurement methods for the characterization of particle size distributions in granulates, bulk materials, powders and suspensions exist. These include laser diffraction, image analysis, dynamic light scattering as well as sieve analysis.
Particle measurement with these different methods leads to different results, because the "size" of particles can be interpreted quite differently: Size is unambiguously defined only for spherical particles (diameter = particle size). In all possible measuring directions, the same result is obtained.
For non-spherical particles, however, the result of the particle measurement depends both on the orientation of the particles during the measurement process and on the peculiarities of the method used. Since the result of a particle measurement depends on how "size" is defined, there is often confusion in the interpretation of the measurement results.
With an extensive understanding of the strengths and weaknesses of each method, Microtrac offers an unrivalled product range of technologies for particle measurement. Our experts will be happy to assist finding the right solution for your application.
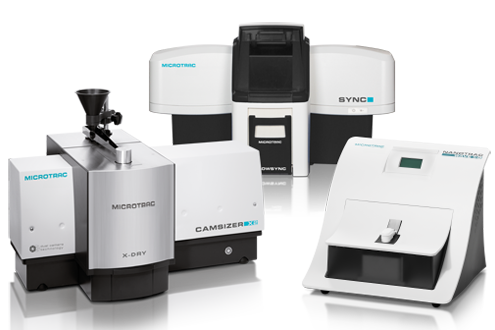
Microtrac offers products for all particle size analysis technologies.
Particle measurement with sieve analysis
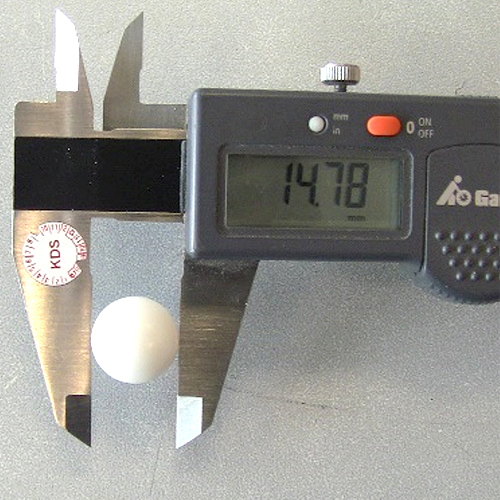
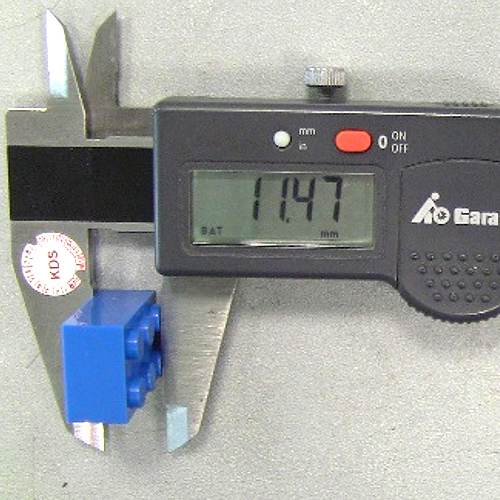
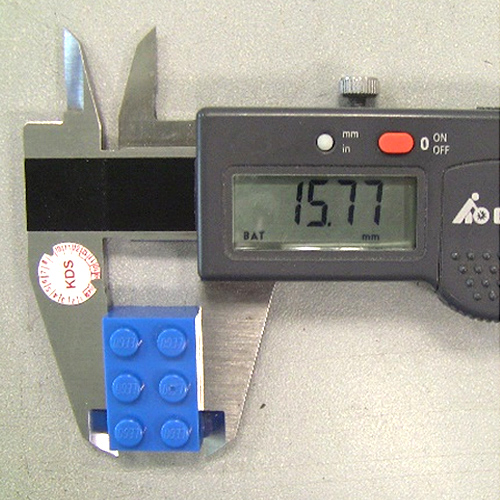
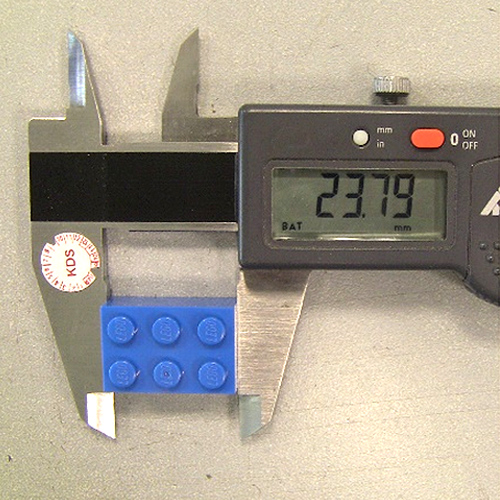
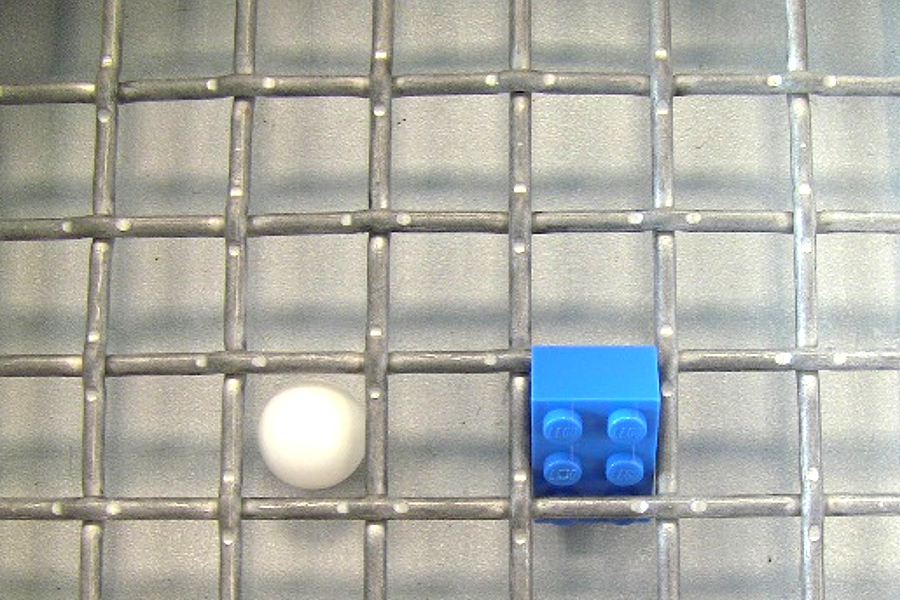
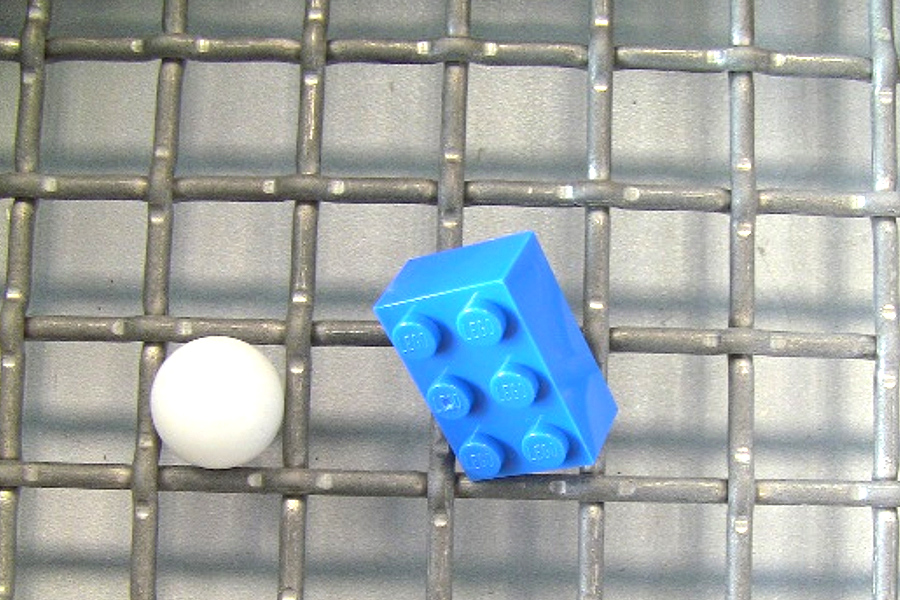
The example below shows particle measurement of two objects, a lego brick and a grinding ball, with two techniques: Sieve analysis and caliper. With the caliper gauge, different sizes are measured depending on the orientation of the brick, while the grinding ball always has the same diameter.
The result of this particle measurement is in any case: the two objects are different in size. Sieve analysis shows that both objects fit through a sieve with 16 mm aperture, while they are retained by a sieve with a mesh size of 14 mm. Sieve analysis thus characterizes both particles as the same size: they have the same equivalent diameter between 14 mm and 16 mm. It is not possible to be more precise, because there are no intermediate sieves.
In sieve analysis, the classical and most commonly used method of particle measurement, the sample is separated by size and the amount of sample in each fraction is determined by weighing. As particles encounter the mesh of the sieve cloth in different orientations during the sieving process, they ideally pass through any mesh until they are retained by apertures smaller than their smallest projected area. Particle measurement with sieve analysis thus always involves a certain preferred orientation of the particles, tending to be a measurement of particle width.
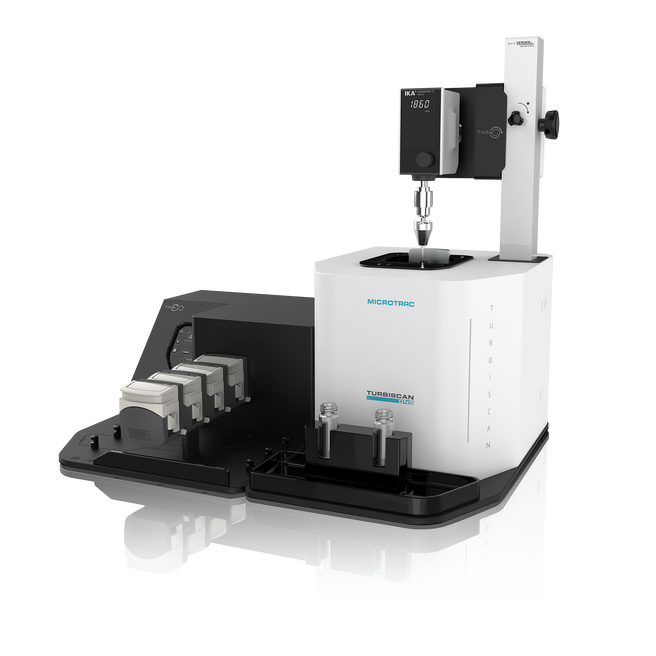
TURBISCAN Technology
When it comes to physical testing, Microtrac has the most extensive range of top-of-the-line analyzers to help you perform comprehensive and informative testing to improve your product ranges.
The TURBISCAN series has devices for aging, shelf-life, dispersibility, redispersion, phase separation, destabilization, and aggregation tests, covering the full profile of potential physical instabilities in your product.
Microtrac recognizes the many challenges of working in the modern laboratory, such as the importance of small-footprint instruments and rapid data analysis to accompany measurements. Thus, all TURBISCAN devices have been designed with speed and efficiency in mind, aiming to minimize the lab footprint. They come equipped with one-click stability evaluations.
Engineered for user-friendliness, the TURBISCAN range requires no expert operators and offers testing conditions between 20 to 60 °C, ensuring your products' stability in any environment upon market release. The inclusion of quantitative analysis simplifies product comparisons and allows you to gauge the effectiveness of process improvements and design changes.
Several instruments, including the TURBISCAN TOWER and TURBISCAN TRILAB, can perform various types of measurements and tests, with the TURBISCAN LAB being recognized as the global standard for stability analysis.
To find out how you can outperform the competition by accelerating your stability studies with more accurate, quantitative data, contact us today. Our team of experts will outline why the TURBISCAN could be the ideal solution for your physical stability testing needs.

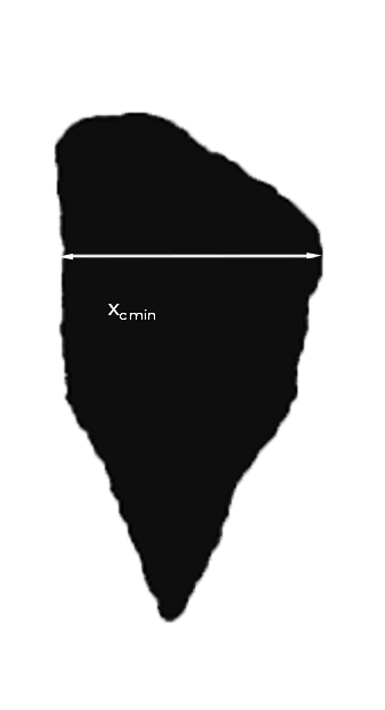
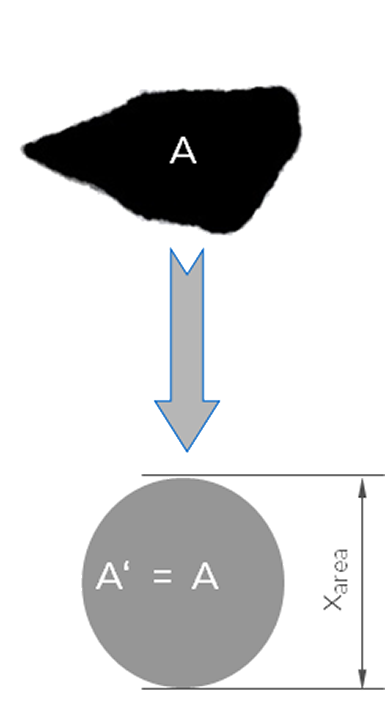
Different size definitions in image analysis. Xc min (particle width, red), Xarea (diameter of the equal area circle, green) and XFe max (particle length, blue). Depending on the selected size definition, a different measurement result is obtained (cumulative curves on the right)
xc min
"Width"
xarea
"Diameter of circle with same projection area"
xFe max
"Length"
3D Particle Measurement with Tracking Technology
In many image analysis methods for particle measurement, each particle is recorded only once in random orientation. Especially for particles with a defined geometry, such as lenses or rods (e.g.: extrudates), it is very likely that the relevant projection is not captured during the acquisition: for example, rods tend to be measured "too short" with random orientation.
To evaluate only the ideal projection during particle measurement, it has proven useful to record the particle several times as it passes through the analyzer's measurement zone. From the sequence with several orientations, the one showing the ideal orientation, e.g. the longitudinal extension in the case of rods, is selected for particle measurement. This also ensures that a circular particle projection actually represents a spherical particle and is not a half-sphere or lens that happens to show a circular cross-section.

Particle measurement with Laser Diffraction
There are some fundamental differences in particle measurement by laser diffraction compared to image analysis.
While in imaging techniques each recorded particle represents a measurement event and is included in the overall result, scattered light or diffraction analysis are so-called ensemble measurement techniques. This means that the measurement signal is generated simultaneously by many particles of different sizes.
It is therefore a superposition of angle-dependent scattered light intensities, from which the contributions of the different particle sizes must be calculated. This is done either via the Mie theory, for which the refractive index of the particles must be known, or via the Fraunhofer approximation, which, however, is only usefully applicable for larger particles.
Particle measurement by laser diffraction cannot distinguish between length and width. All scattered light data are referred to a spherical model, they are so-called equivalent diameters. For non-spherical particles, this usually results in a wider distribution being output than in image analysis.
Particle measurement with Dynamic Light Scattering (DLS)
Dynamic Light Scattering (DLS) is a method for particle measurement which is particularly suitable for the analysis of nanoparticles. Sample materials include suspensions and emulsions, dry samples cannot be analyzed. An advantage of this method is that particle measurement can be carried out in a very wide concentration range from a few ppm to ideally 40% by volume.
A special feature of particle measurement with dynamic light scattering is, that a so-called hydrodynamic diameter is determined. This hydrodynamic diameter indicates the size of a sphere that has the same diffusion properties in a liquid as the real particle. It follows that the particle shape is not determined here either.
Moreover, when the particle diffuses in the liquid, not only the particle itself moves, but also some of the surrounding molecules of the dispersing medium, which means that the hydrodynamic diameter is always slightly larger than the actual particle diameter. In particle measurement with dynamic light scattering, the diffusion coefficient is determined and the hydrodynamic particle diameter is calculated via the Stokes-Einstein equation.

Comparability of particle measurement with different methods
Image Analysis and sieve analysis: very good comparability when image analysis considers particle width during image evaluation. 3D analysis improves the comparability. Particle measurement by image analysis can completely replace sieving!
Image Analysis and Laser Diffraction: Good comparability. Laser diffraction often shows wider distributions, especially for strongly irregular shaped particles. For image analysis, the definition xarea should be used.
Sieve analysis and Laser Diffraction: poorly comparable, laser diffraction tends to give a larger result.
Laser Diffraction and Dynamic Light Scattering: compares well, for small particles (< 100nm) DLS is better, for large particles (>1µm) laser diffraction is superior.
Contact us for a free consultation
Ultimately, the choice of whether to use a simple sieving solution or to invest in Laser Diffraction or Dynamic Image Analysis will depend on the volume of testing, the budgets and staffing available and any specific international standards or customer requirements that you face.
Why not contact Microtrac for a free consultation to find out which solution will deliver the outcome and the Return on Investment you need?