


The most common techniques to determine particle size distribution are dynamic image analysis (DIA), static laser light scattering (SLS, also called laser diffraction), dynamic light scattering (DLS) and sieve analysis.
This article presents the advantages and drawbacks of each technique, and their comparability among each other.
Each method covers a characteristic size range within which measurement is possible. These ranges partly overlap. DIA, SLA and sieving, for example, all can measure particles in a range from 1 µm to 3 mm. However, the results for measuring the same sample can vary considerably.
The table below provides an overview of the measuring ranges of the various technologies and the associated analyzers from Microtrac.
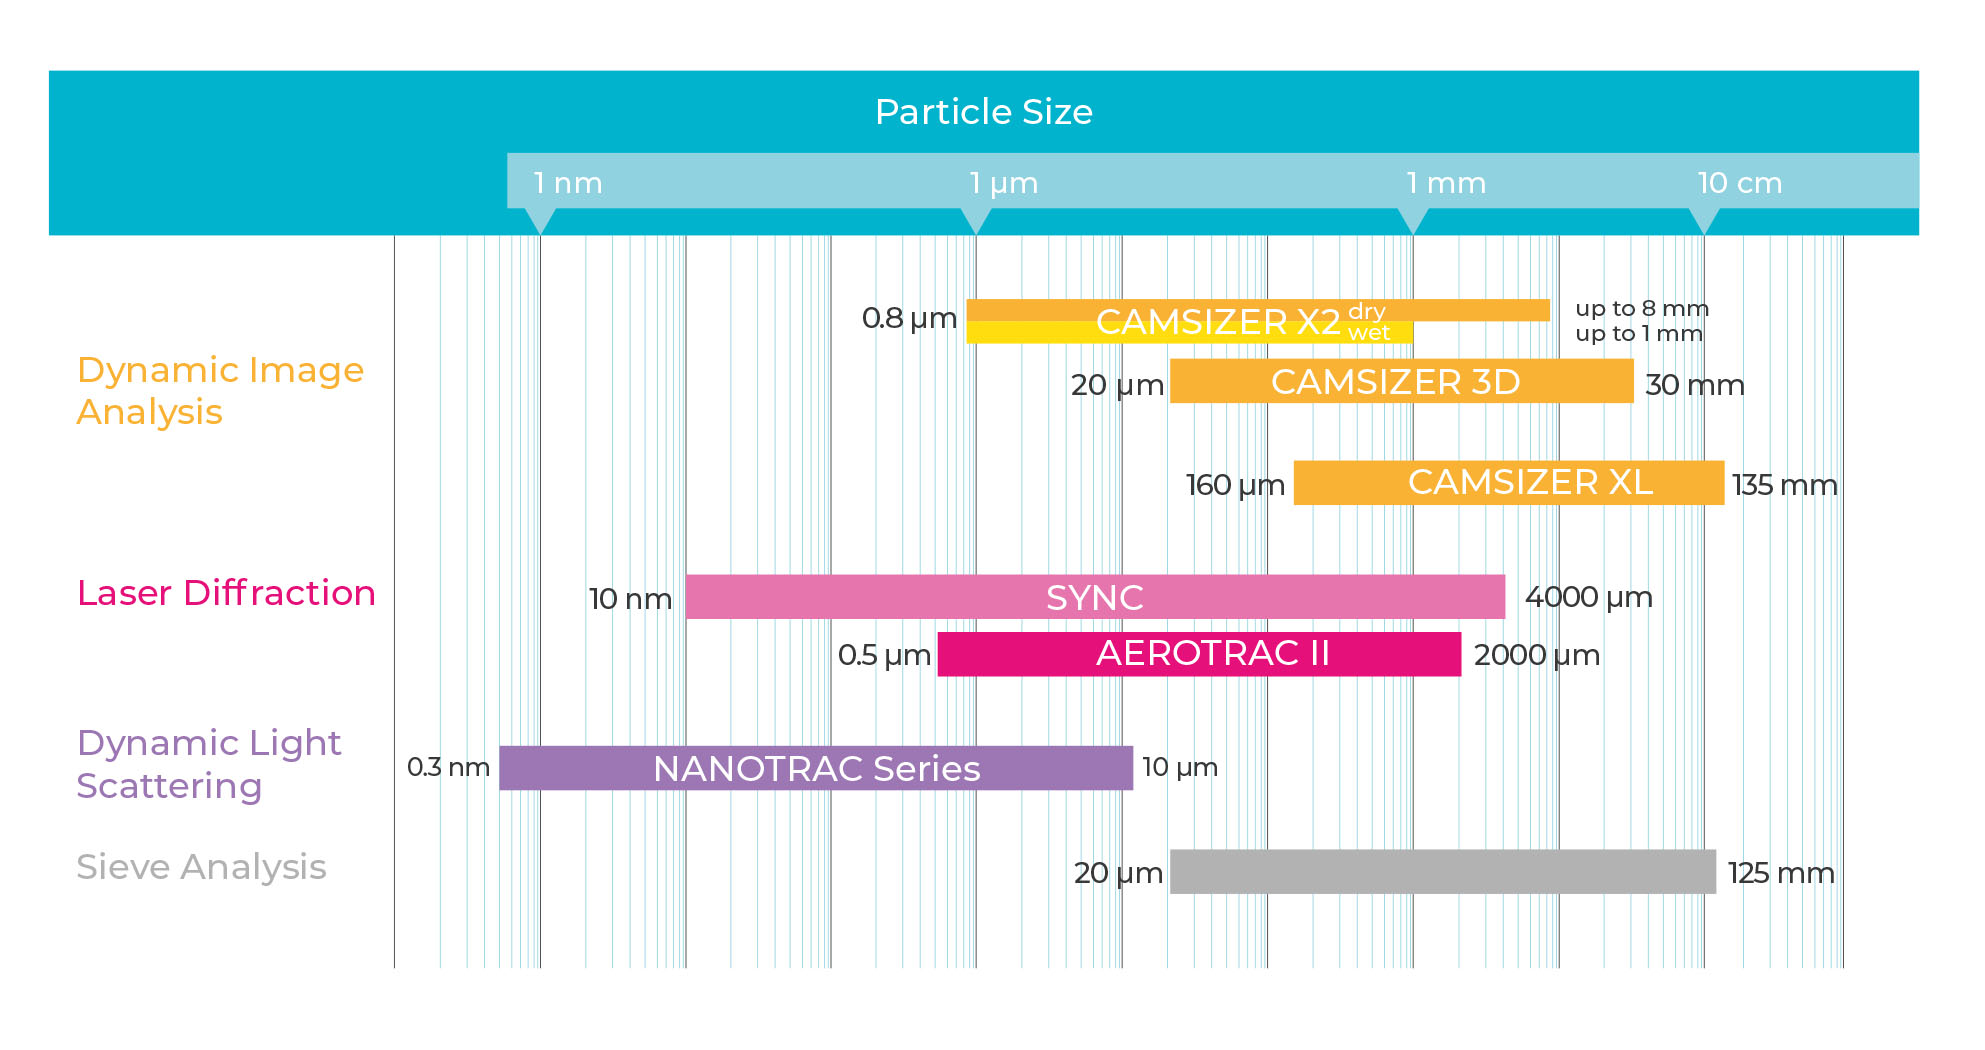
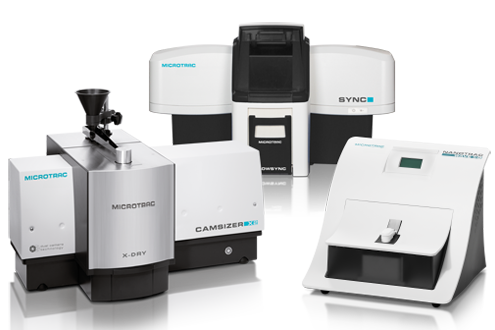
Microtrac offers products for all particle size analysis technologies.
Sieve Analysis: Committed to tradition
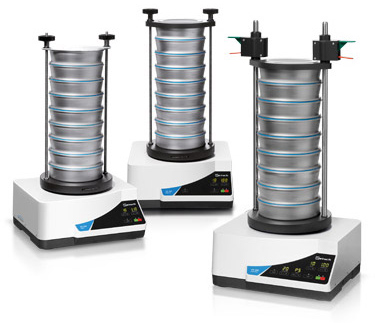
Sieve analysis still is the traditional and most commonly used method for particle size determination. A sieve stack consists of several sieves with increasing aperture size stacked upon each other and the sample is placed on the uppermost sieve.
The stack is clamped to a sieve shaker and set into vibration for usually 5 – 10 minutes. As a result, the particles are distributed to the sieves in the stack (fractions) according to their size.
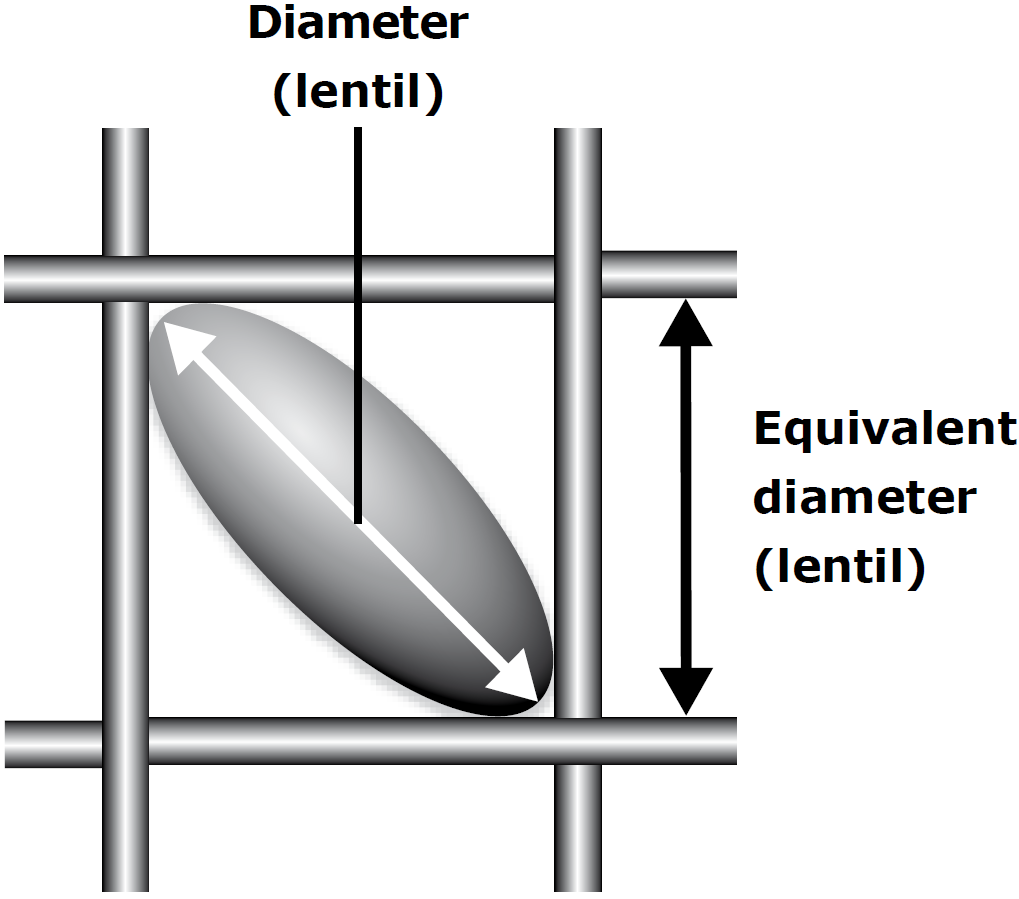
Ideally, the particles pass the smallest possible sieve aperture with their smallest projection surface. Taking cubic particles as a model, this corresponds to the edge length of the cube. For lenticular particles, the size determined by sieve analysis would be a value between the thickness and the diameter of the lense, as the particle is oriented diagonally towards the sieve aperture (see figure on the right).
Hence, sieve analysis is a technique which measures particles in their preferred orientation with a tendency to determine mostly the particle width.
Sieve analysis is carried out up to a point where the sample mass on the respective sieves no longer changes (= constant mass). Each sieve is weighed, and the volume of each fraction is calculated in percent by weight, providing a mass-related distribution.
The resolution of sieve analysis is limited by the number of obtainable size fractions. A standard sieve stack consists of a maximum of 8 sieves which means that the particle size distribution is based on only 8 data points. Automation of the procedure is hardly possible which makes it rather time-consuming. The processing steps of sieve analysis are initial weighing, 5 – 10 minutes sieving, back weighing, and cleaning of the sieves.
The most common sources of errors are overloading of the sieves (blocking of sieve apertures, too coarse results); old, worn or damaged sieves (too fine results), or errors in data transfer. It should also be taken into account that the aperture sizes of new standard-compliant sieves are also subject to certain tolerances.
The average real aperture size of a 1 mm sieve, for example, is permitted to deviate about ±30 µm, for a 100 µm sieve it is ±5 µm (i.e. the average real aperture size lies between 95 and 105 µm). However, this is just the mean value which implies that some of the apertures can be even larger.
Dynamic image analysis and sieving
With Dynamic Image Analysis (DIA), a large number of particles is moved past a camera system and analyzed in real time.
Modern DIA systems acquire several hundred frames per second in and evaluate millions of individual particles within a few minutes.
Fast cameras, bright light sources, short exposure times and powerful software are the prerequisites for this. The image below shows the measuring principle of Microtrac's CAMSIZER series as an example for a DIA analyzer.
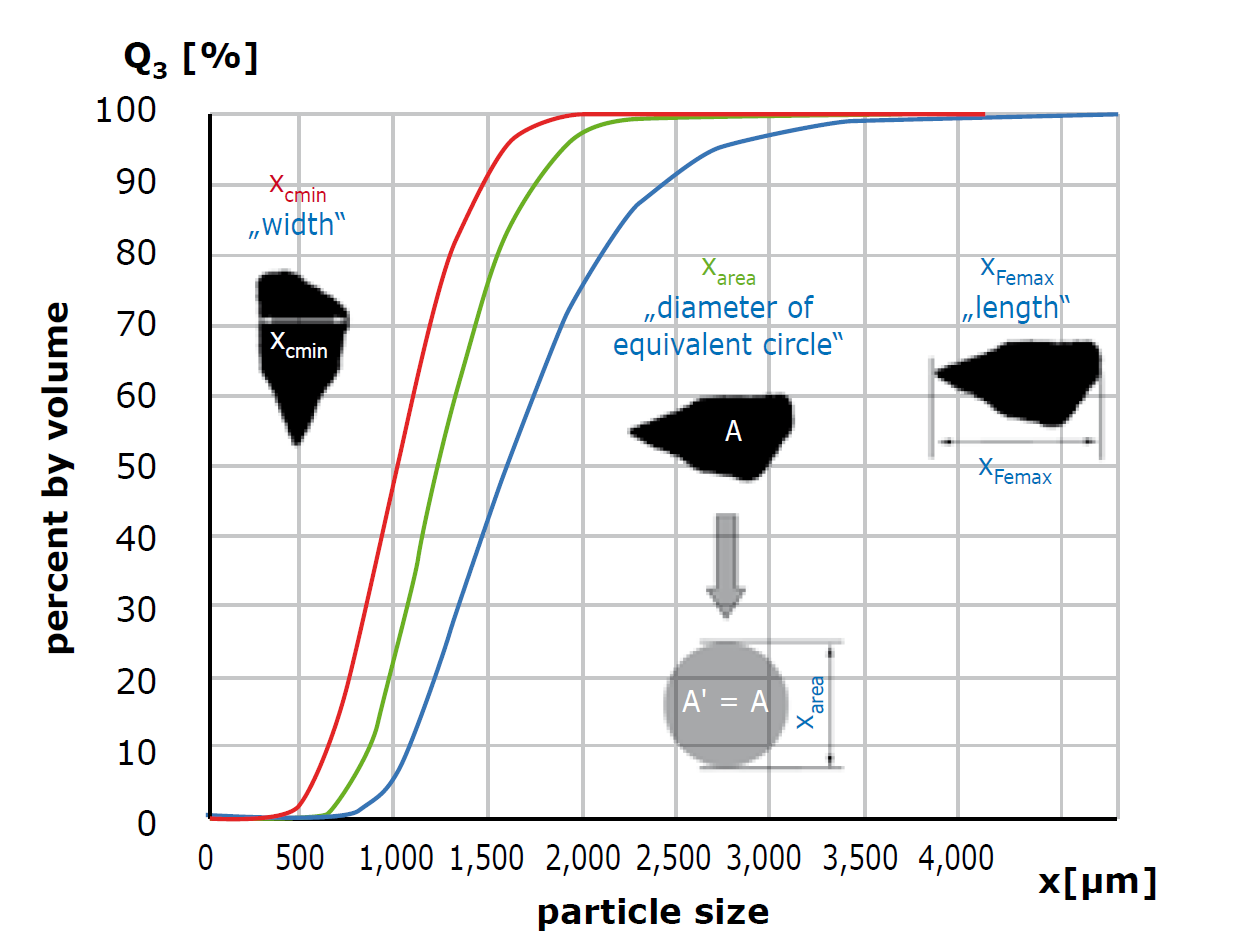
In contrast to sieve analysis DIA measures the particles in a completely random orientation. A variety of size as well as shape parameters are determined based on the particle images. Typical size parameters are, for example, breadth, length and diameter of equivalent circle (see Figure below).
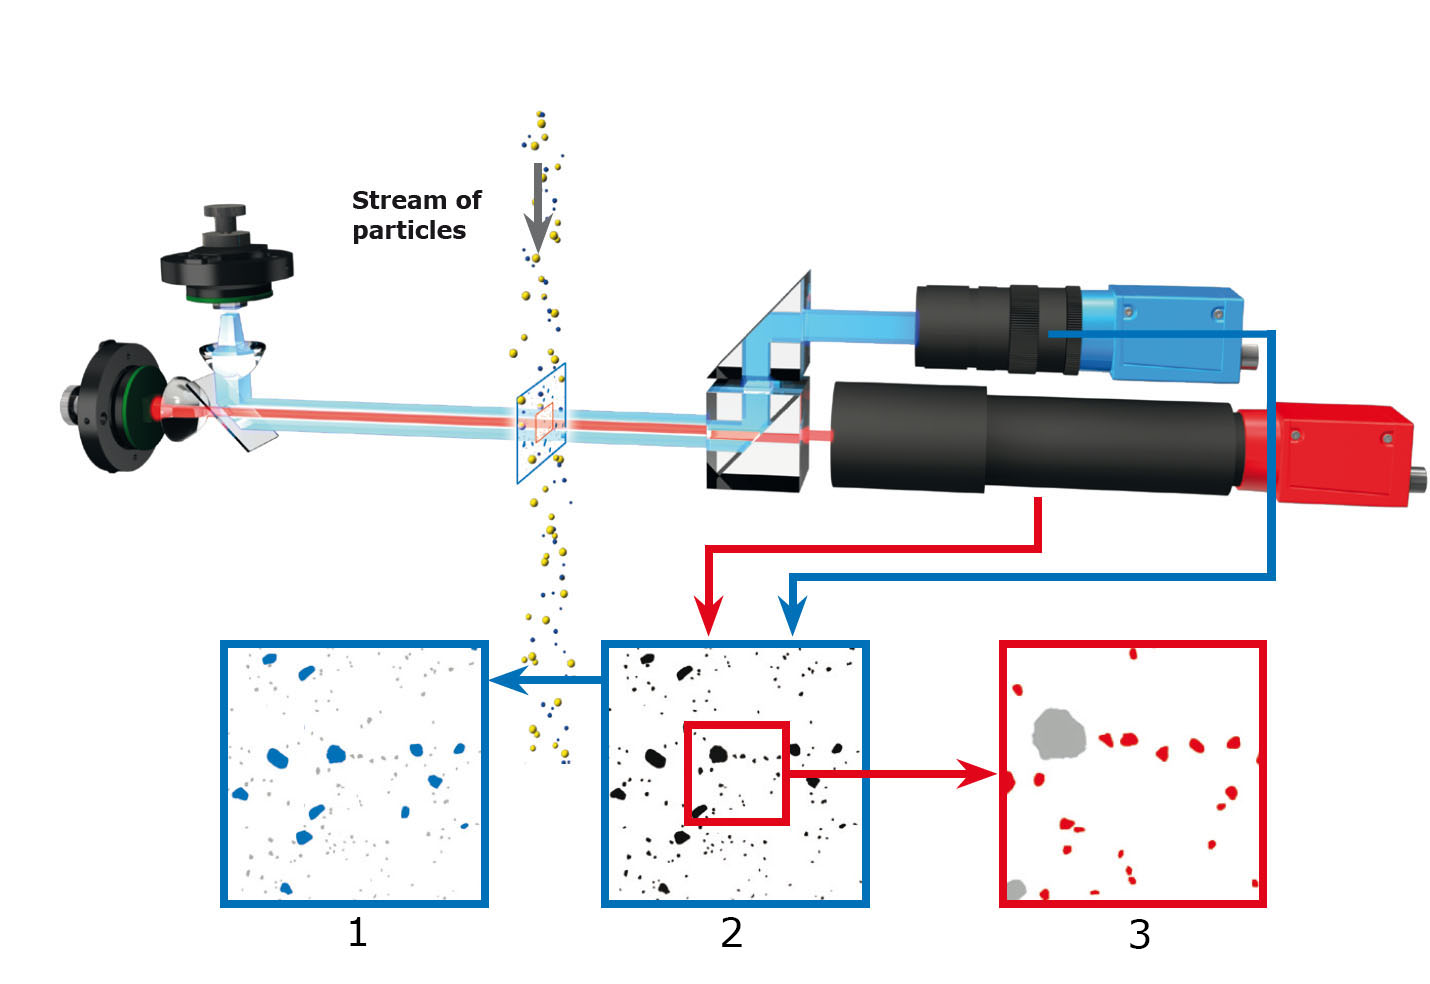
1. The basic camera detects the larger particles.
2. The complete particle flow is recorded by two cameras.
3. The zoom camera analyzes the smaller particles.
Parameters to describe the particle shape include sphericity, symmetry, convexity and aspect ratio. An essential characteristic of DIA is the extremely high detection sensitivity for oversized grains. The CAMSIZER® P4, for example, is designed to detect every single particle of a sample; the model CAMSIZER® X2 has a detection limit of 0.01 % for oversized particles. The resolution of DIA systems is also unbeatable: smallest size differences within the micrometer range are reliably detected and multimodal distributions are resolved without fail.
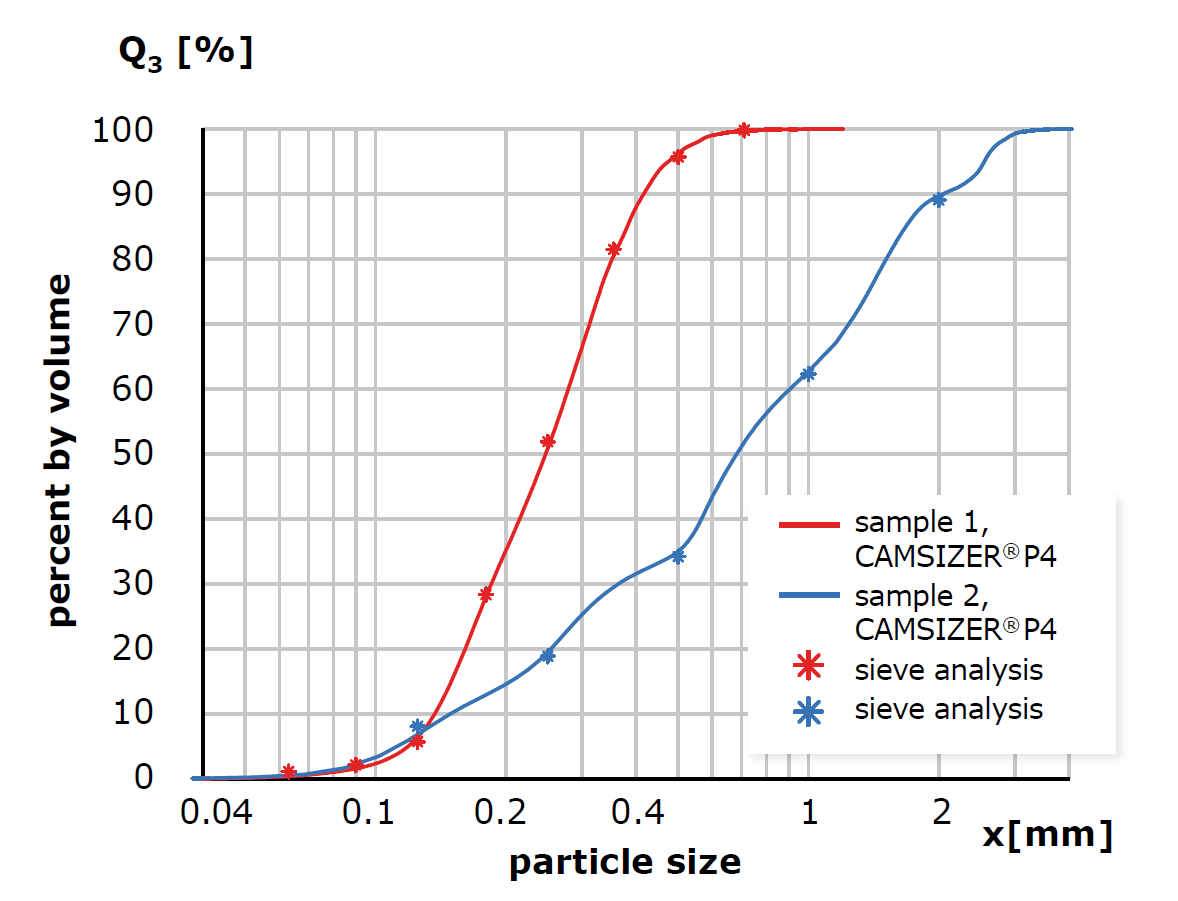
If DIA is compared to sieve analysis, the particle “width” is the best parameter. However, when measuring irregularly shaped particles there are still systematic differences in the obtained results because DIA measures the particles in random orientation. The differences in particle size distributions are characteristic for each defined particle shape. The CAMSIZER® software features algorithms which allow to correlate the DIA results to almost 100 % to those obtained by sieve analysis (see Fig. below). This procedure is frequently applied in particle size analysis applications for quality control because in a globalized market many products are analyzed by different laboratories with different measuring techniques, creating a need for comparability.
Dynamic Image analysis and Laser Diffraction
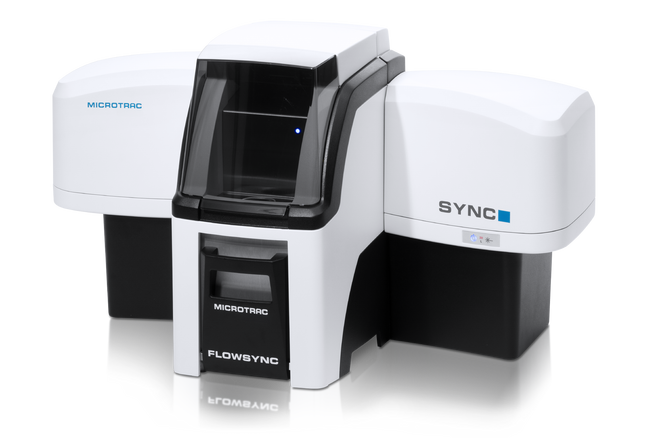
With static laser light scattering (SLS) analysis, also called laser diffraction, particle size is measured indirectly by detecting intensity distributions of laser light scattered by particles at different angles. The figure below shows the setup of the Microtrac SYNC, a state-of-the-art laser granulometer with its unique Tri-Laser-Geometry and an additional camera module.
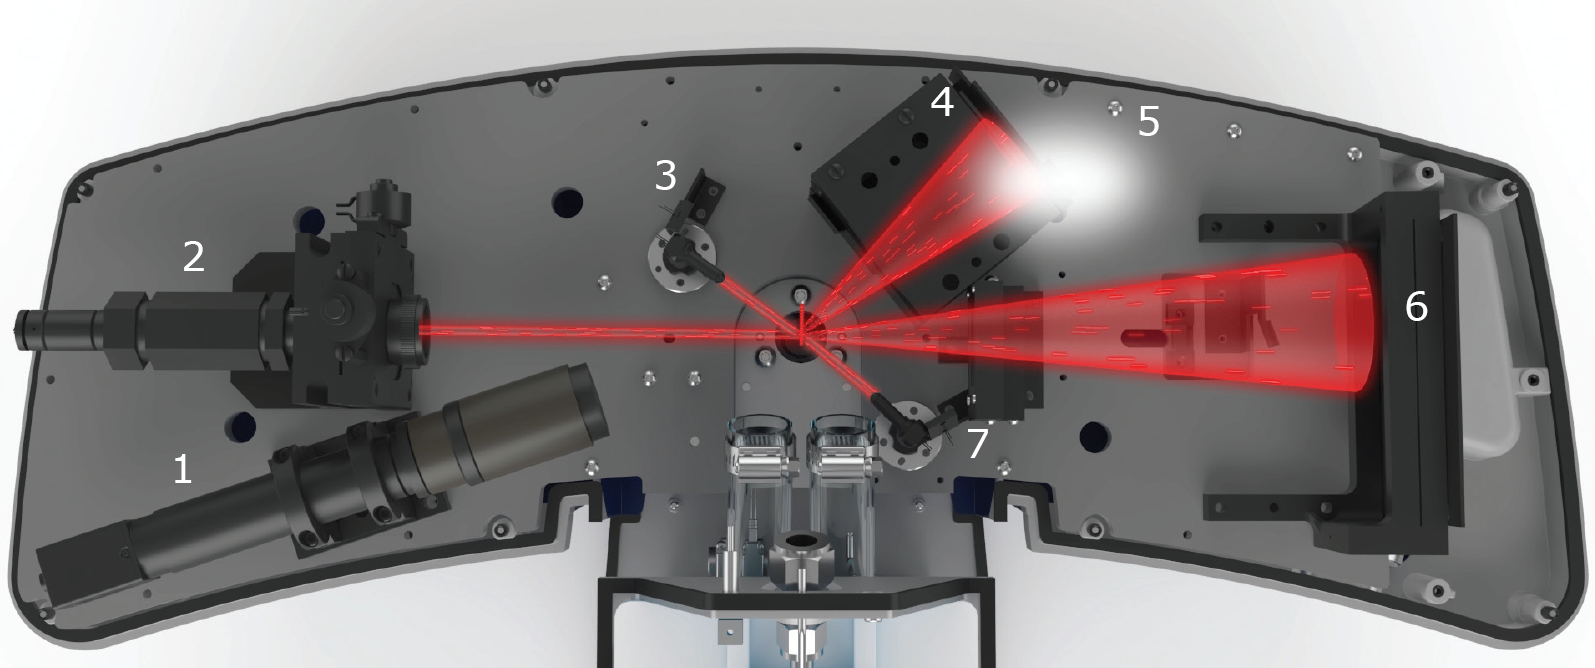
This technique is based on the phenomenon that light is scattered by particles and the correlation between intensity distribution and particle size is well-known. Simply put, large particles scatter the light to small angles while small particles produce large angle scattering patterns.
Large particles produce rather sharp intensity distributions with distinctive maxima and minima at defined angles, the light scattering pattern of small particles becomes more and more diffuse and the overall intensity decreases. It is particularly difficult to measure differently sized particles in a polydisperse sample as the individual light scattering signals of the particles superimpose each other.
Static laser light scattering (SLS) is an indirect method which calculates particle size distributions based on super-imposed scattered light patterns caused by a whole collective of particles. Additionally, the optical properties of the material (refractive index) must be known for small particles for the calculation to produces reliable results.
Since the theory of SLS is based on the assumption of spherical particles, shape evaluation is not possible. A disadvantage of the SLS is the relatively low resolution and sensitivity. Oversized grain can also only be detected by modern analyzers from approx. 2 vol%. In order to resolve multi-modal distributions, the size of the two components must differ by at least a factor of 3.
The big advantage of laser diffraction is that it is a fast, established technique offering great flexibility. With a measuring range from a few nanometers to millimeters, the method can be used for most requirements in particle technology. Image analysis cannot be used for particles <1 µm. The analyses with SLS devices are easy to carry out and can be largely automated.
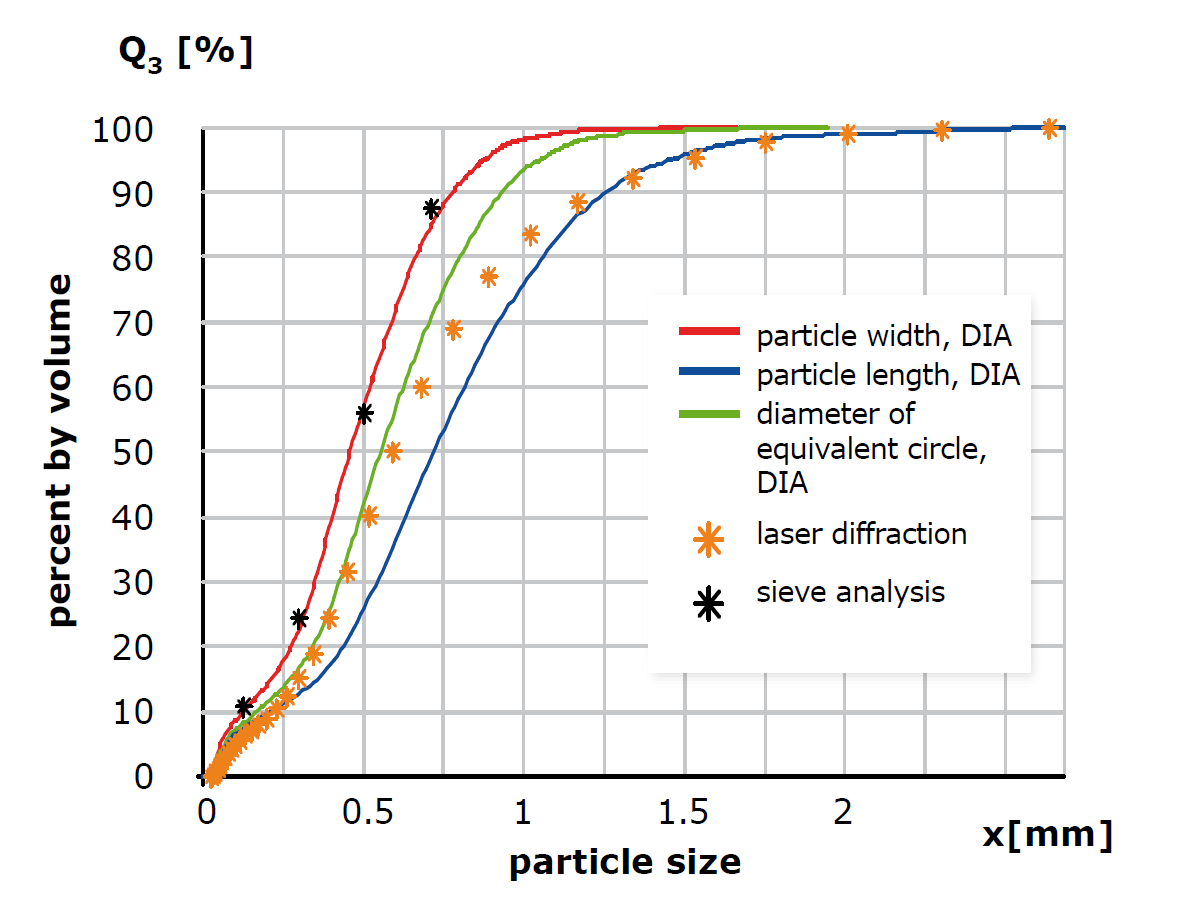
The figure above on the left shows the comparison between SLS, DIA and sieving using the example of a sample of ground coffee. The sieve analysis provides the finest result, the width measurement of the CAMSIZER® X2 (DIA) giving a comparable result when particle width is considered. Laser analysis makes it impossible to compare the sieving, the result corresponds approximately to the xarea (diameter of the circle with the same area) od DIA. However, all particle dimensions are included in the result, which are then related to spherical particles. That is why SLS always delivers broader distributions than image analysis.
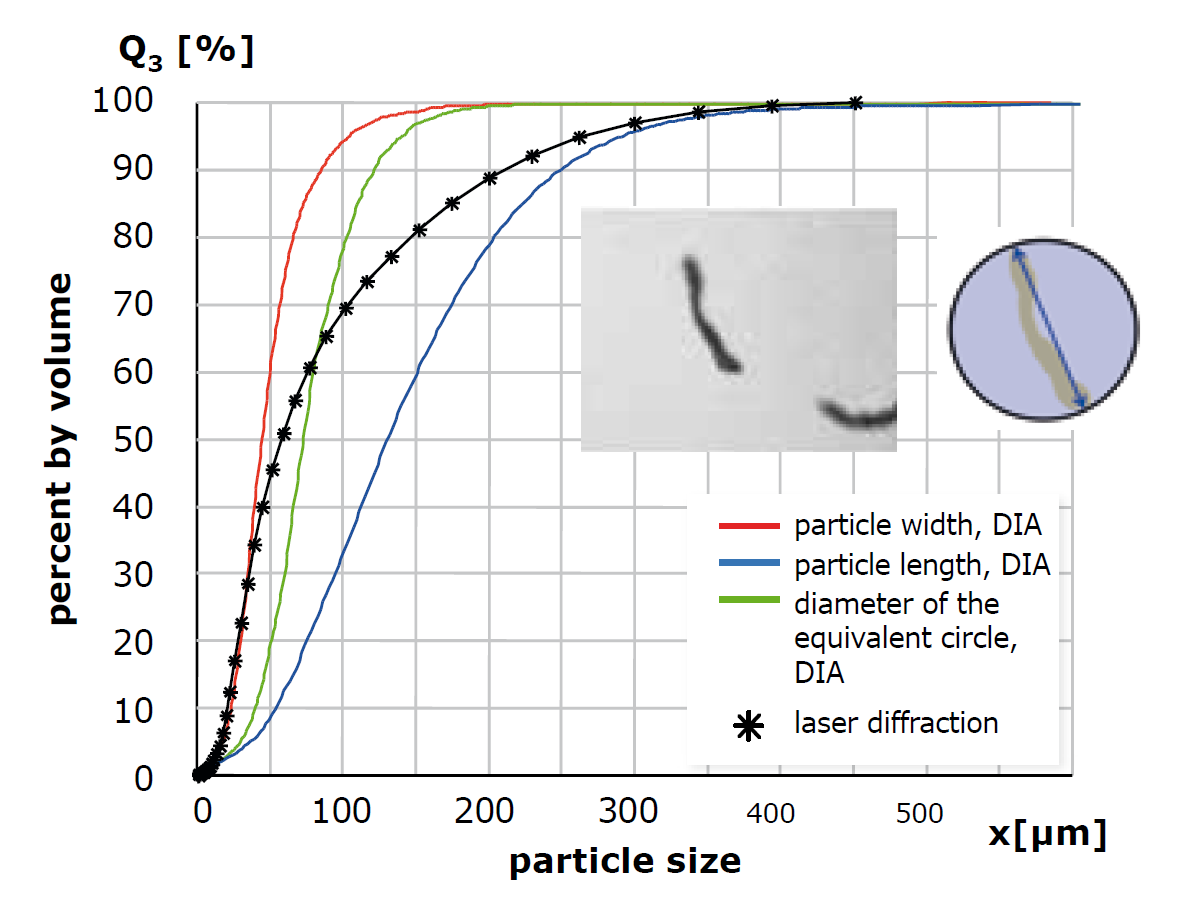
This becomes even clearer in the right image. Here, a sample of cellulose fibers was measured with the CAMSIZER® X2 and comparably with a laser granulometer. While image analysis differentiates between fiber thickness and length, this is not possible with laser diffraction. The measurement curve of the SLS initially runs parallel to the width measurement and then approaches the "fiber length".
Particle measurement with Laser Diffraction
There are some fundamental differences in particle measurement by laser diffraction compared to image analysis.
While in imaging techniques each recorded particle represents a measurement event and is included in the overall result, scattered light or diffraction analysis are so-called ensemble measurement techniques. This means that the measurement signal is generated simultaneously by many particles of different sizes.
It is therefore a superposition of angle-dependent scattered light intensities, from which the contributions of the different particle sizes must be calculated. This is done either via the Mie theory, for which the refractive index of the particles must be known, or via the Fraunhofer approximation, which, however, is only usefully applicable for larger particles.
Particle measurement by laser diffraction cannot distinguish between length and width. All scattered light data are referred to a spherical model, they are so-called equivalent diameters. For non-spherical particles, this usually results in a wider distribution being output than in image analysis.
Contact us for a free consultation
Ultimately, the choice of whether to use a simple sieving solution or to invest in Laser Diffraction or Dynamic Image Analysis will depend on the volume of testing, the budgets and staffing available and any specific international standards or customer requirements that you face.
Why not contact Microtrac for a free consultation to find out which solution will deliver the outcome and the Return on Investment you need?