


Particle concentration, in addition to particle size and zeta potential, is often of interest to determine how many particles are dispersed in a liquid or how many particles are present per size class. This information is very useful, for example, to determine the therapeutic window of a drug in the pharmaceutical industry or an indication of opacity in inks or paints. These are only a few examples, many more applications exist.
With Microtrac's Dynamic Light Scattering (DLS) analyzer series NANOTRAC it is now possible not only to measure particle size, molecular weight, and zeta potential, but also to obtain additional information about particle concentration. The different models of the Nanotrac series are shown in the picture below.
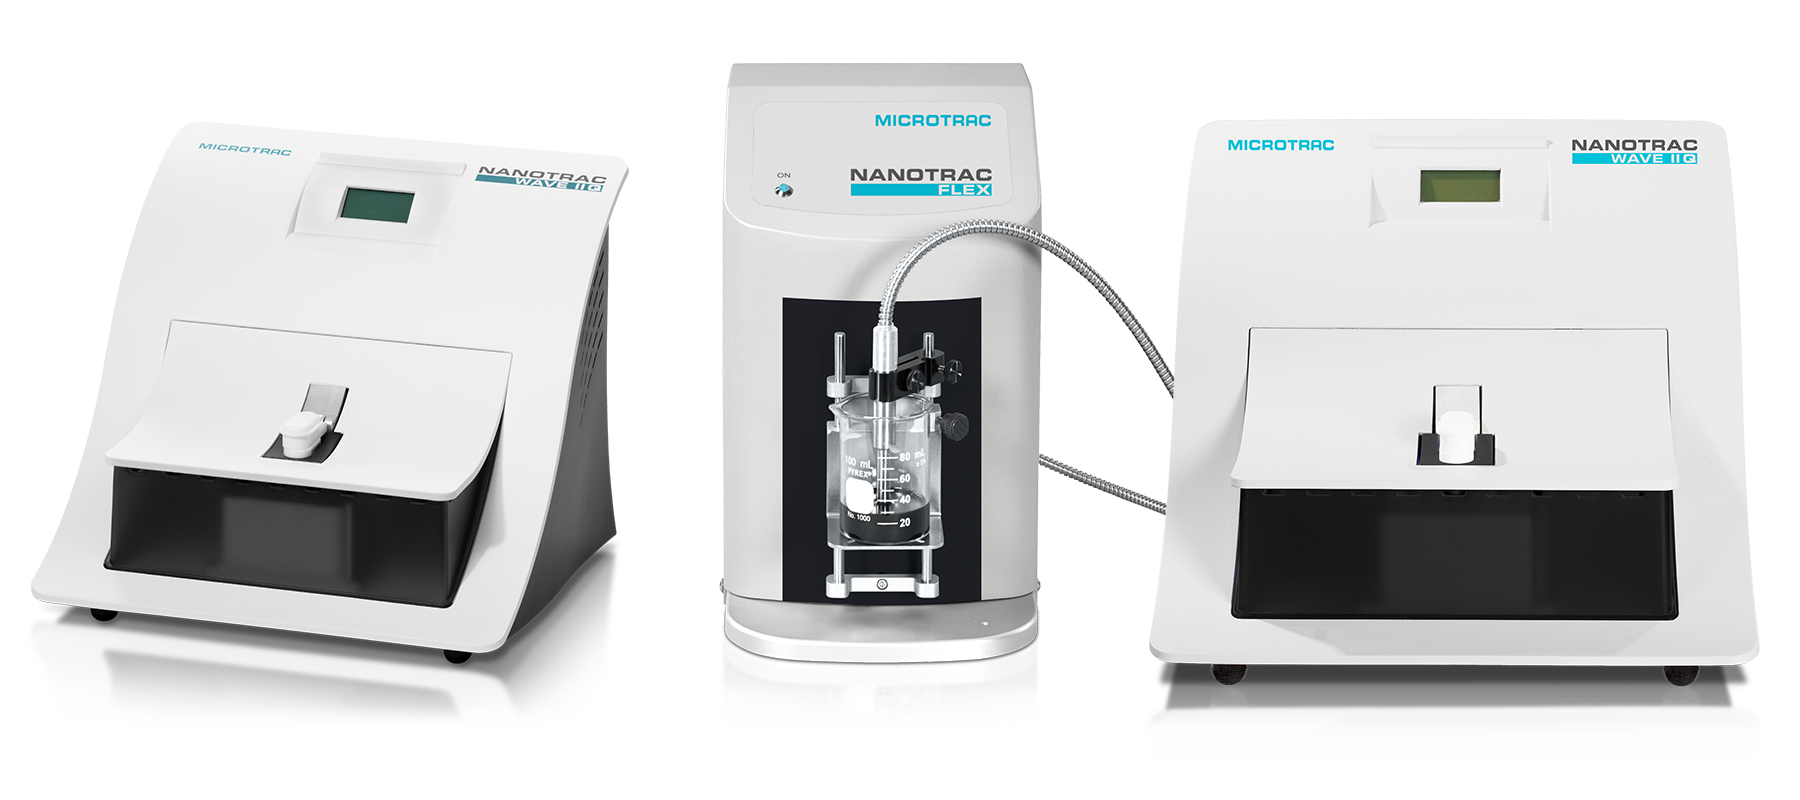
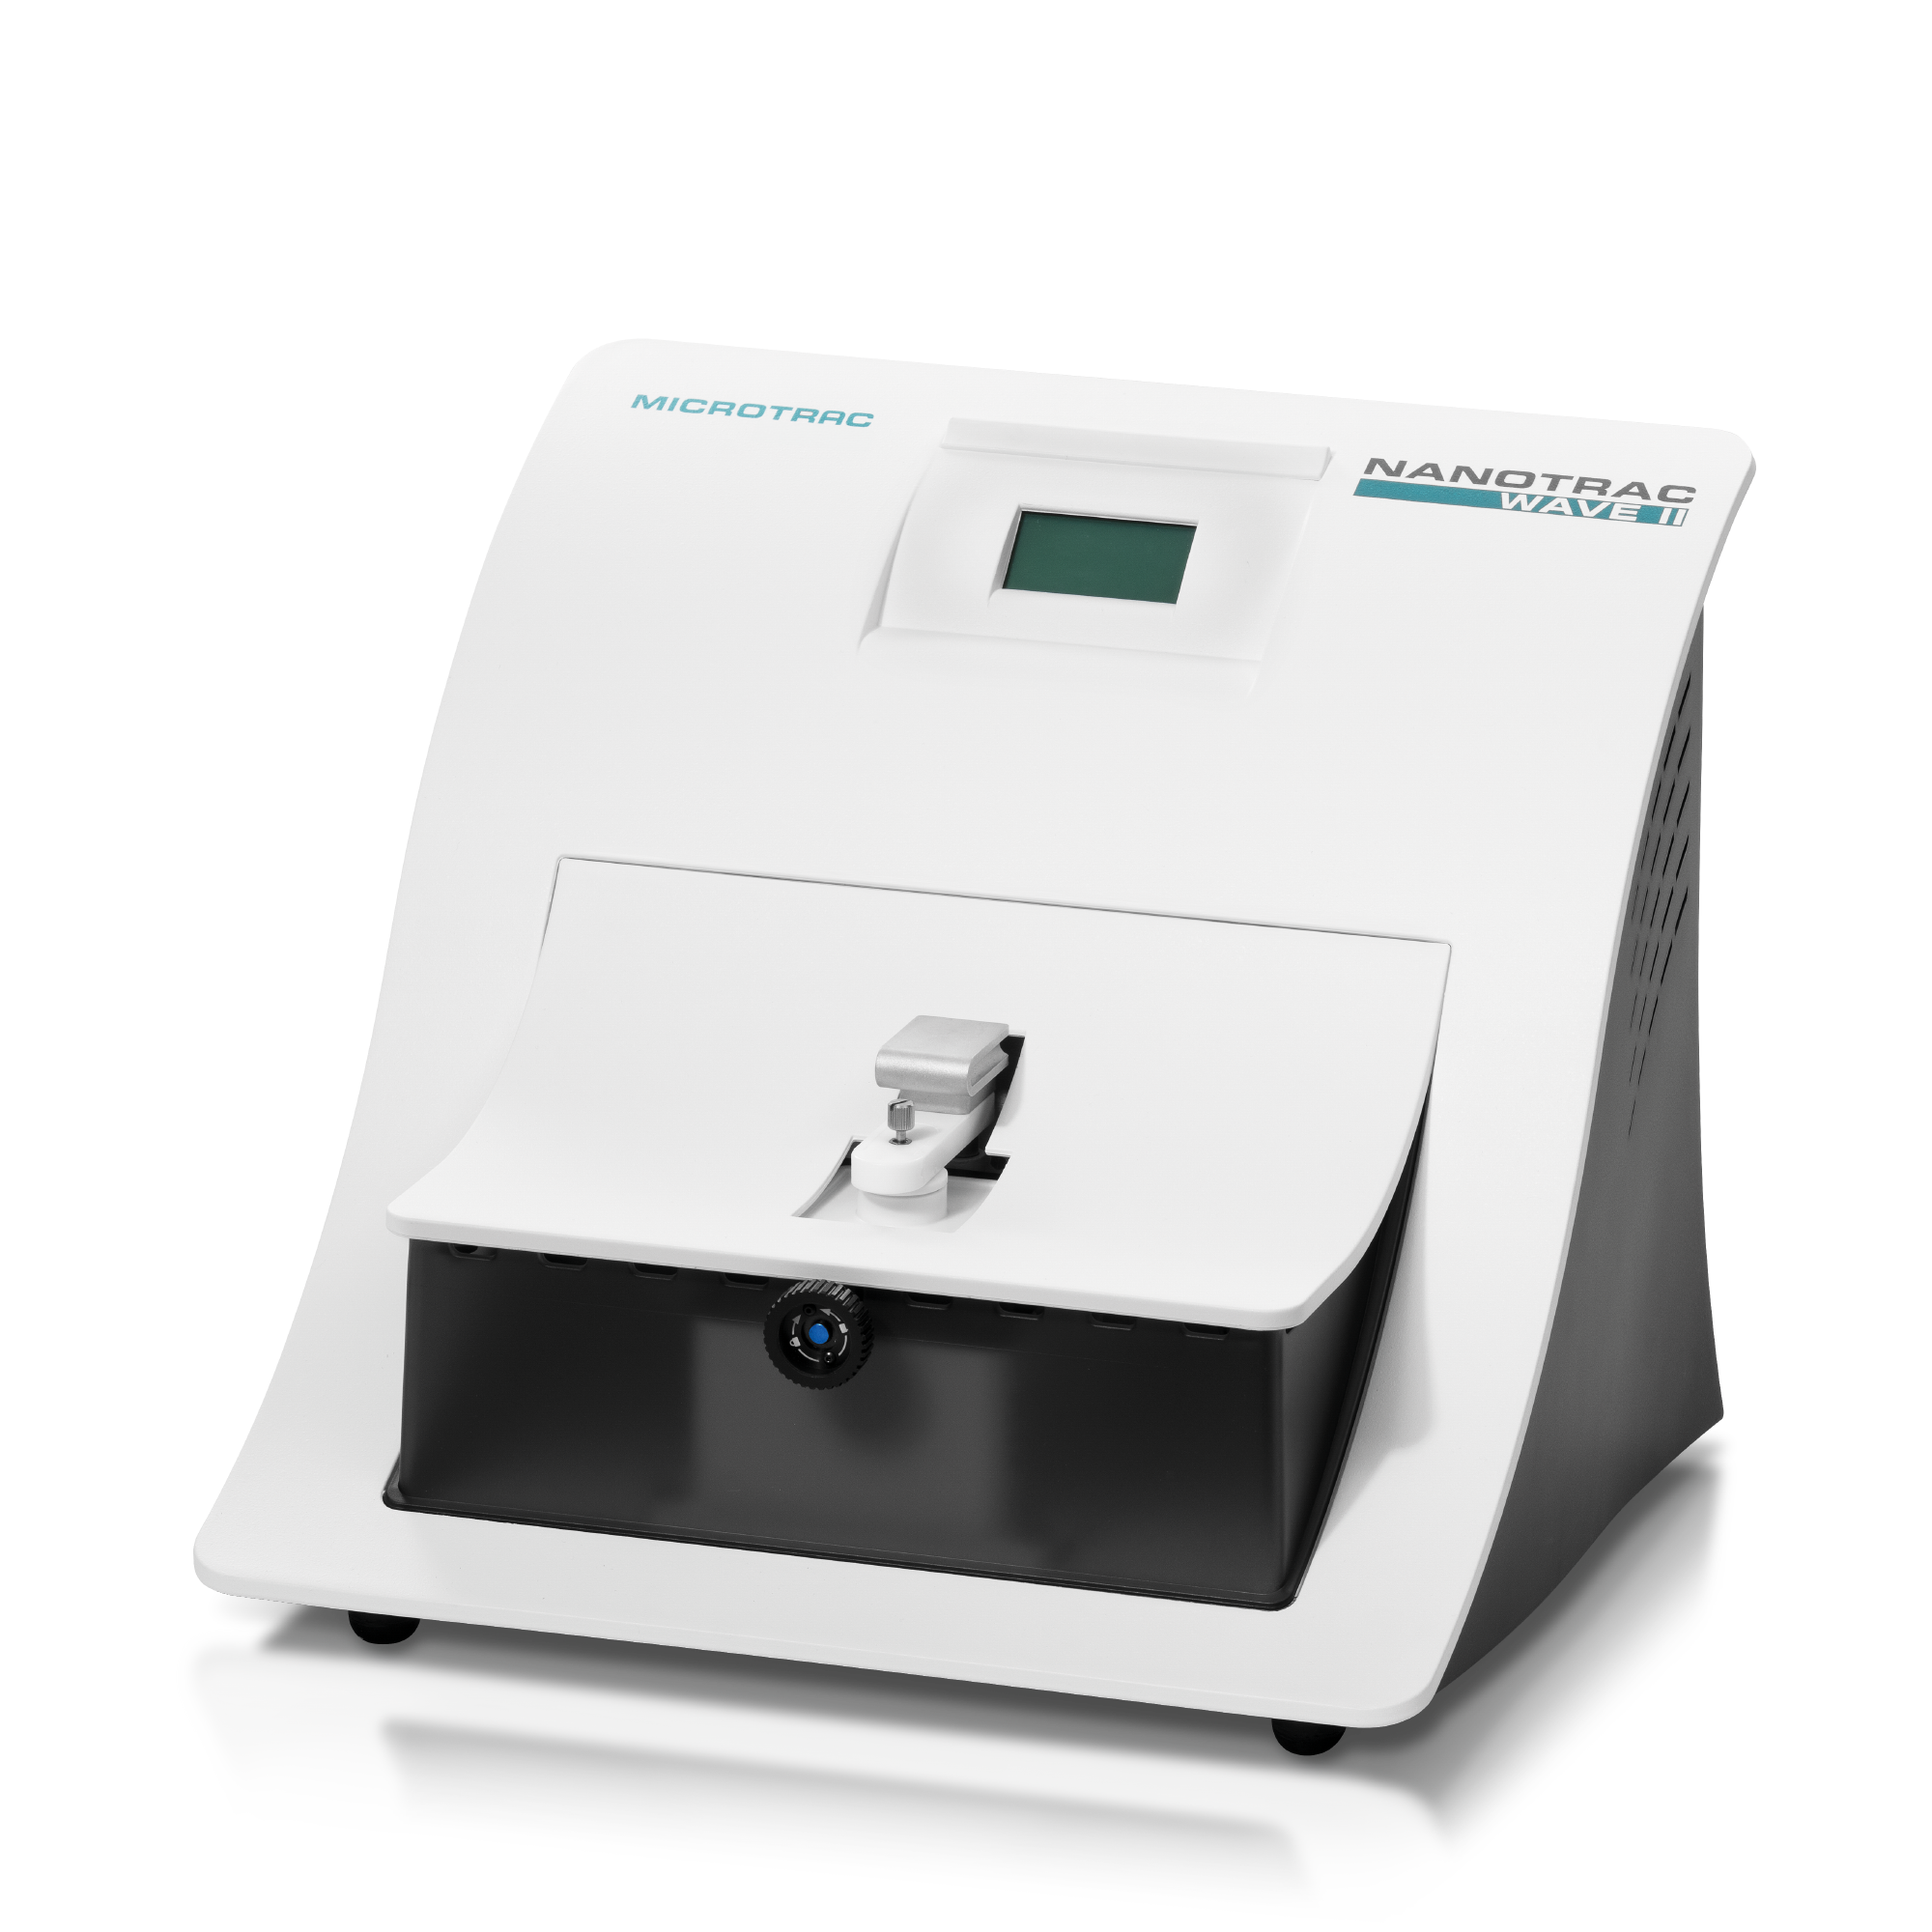
Get to know Microtrac's NANOTRAC series.
How is the particle concentration determined?
The unique optical design of the Nanotrac series with the 180° self-amplifying heterodyne reference method has a 106 times better signal-to-noise ratio than PCS instruments. A fast Fourier transform of the signal amplified by the reflected laser results in a linear frequency power spectrum, which is converted to a logarithmic power spectrum.
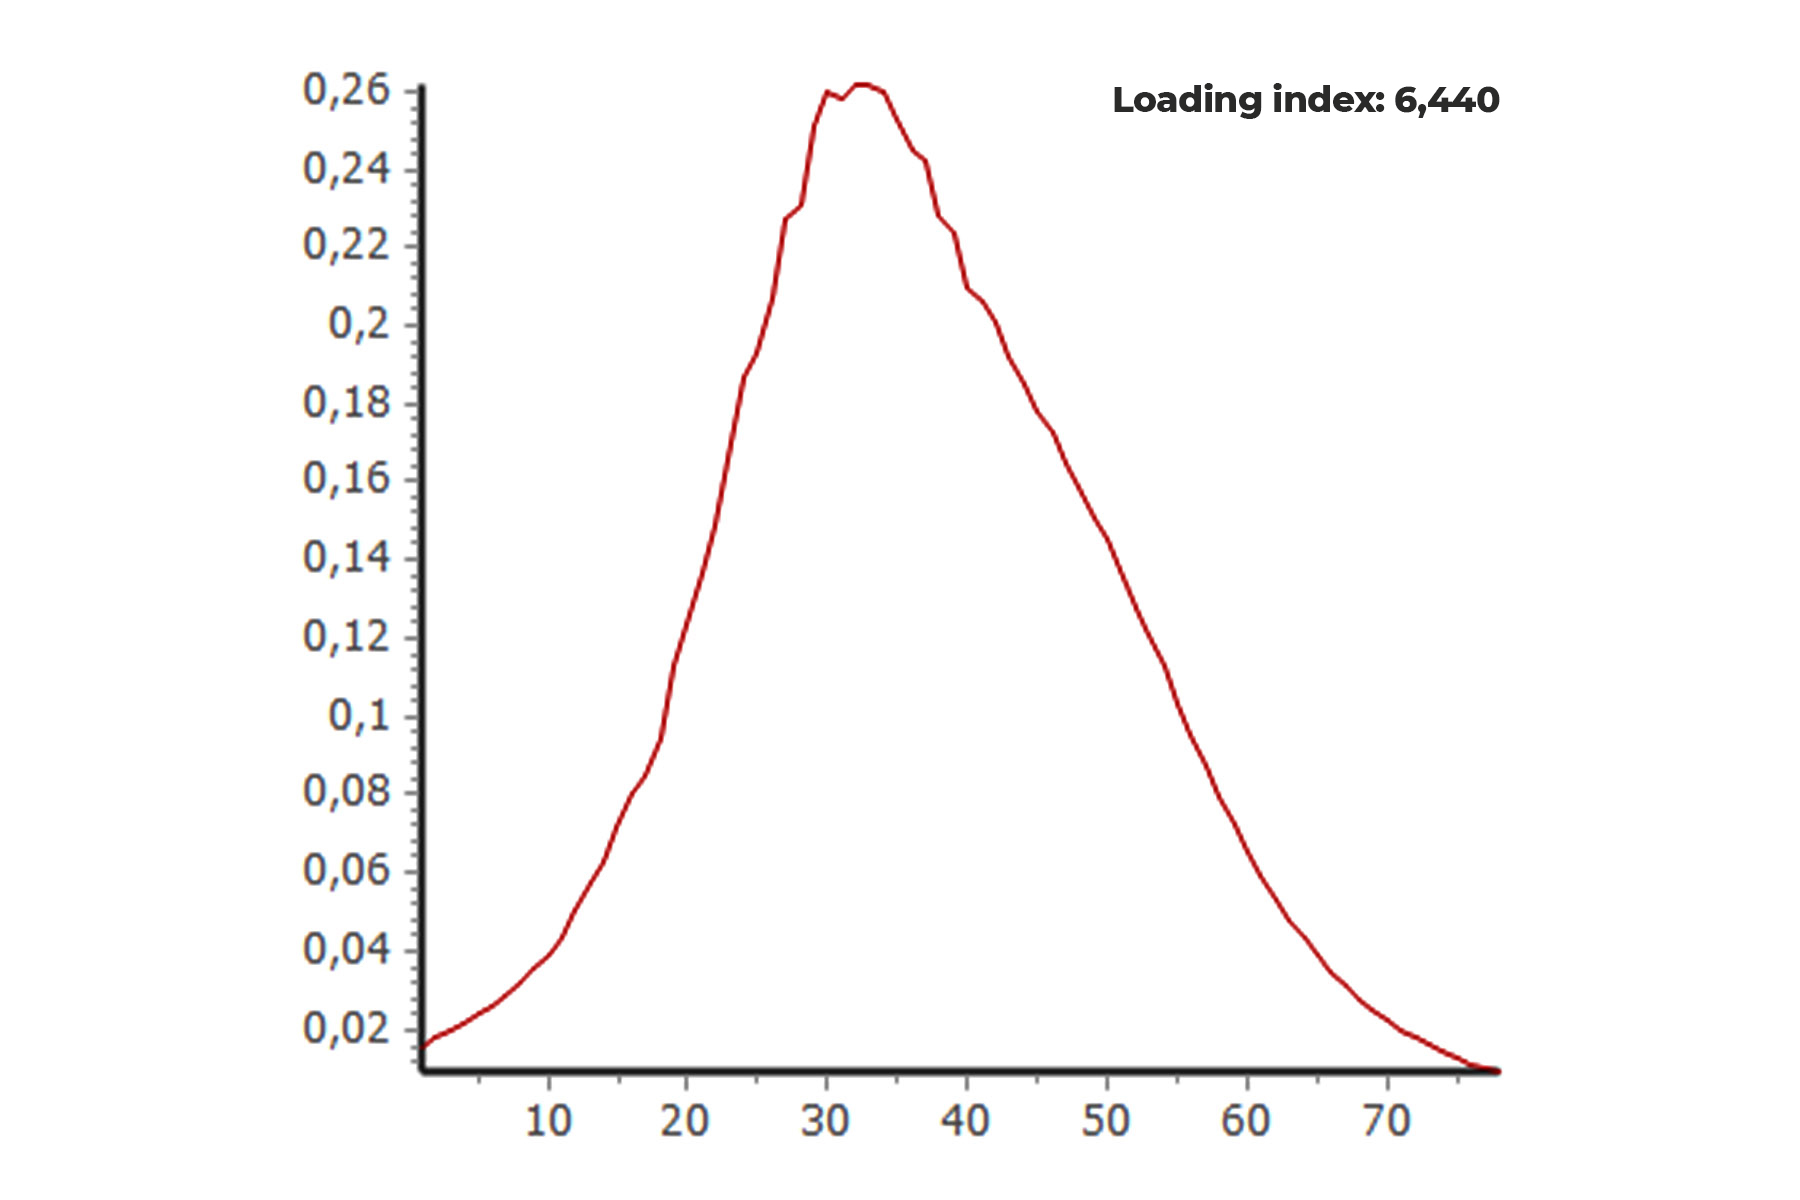
The additional information of the particle concentration is accessible using this power spectrum and the resulting Loading Index (LI). The power spectrum is shown in the figure. The Loading Index is the sum of the amplitudes of all logarithmic frequency channels and depends on the particle concentration. Few particles show a low Loading Index, a high concentration results in a high Loading Index.
To calculate the particle concentration, the "Mode" analysis in the SOP (Standard Operation Procedure) must be selected. When using this analysis method, the power spectrum is divided into different modes. Thus, a Loading Index can be calculated from each individual mode internally and assigned to individual fractions. In this way, the concentration of individual particle fractions can also be determined.
The classification of the modes and the assignment to the particle fractions takes place fully automatically. Depending on the selected particle size representation, the concentration is displayed in cubic centimetres per millilitre (cc/ml), which would be the case for an intensity weighted or volume weighted size representation. For a number-based size representation, the concentration is reported in number of particles per millilitre (N/ml).
Particle Concentration Application Examples of particle concentration measurement
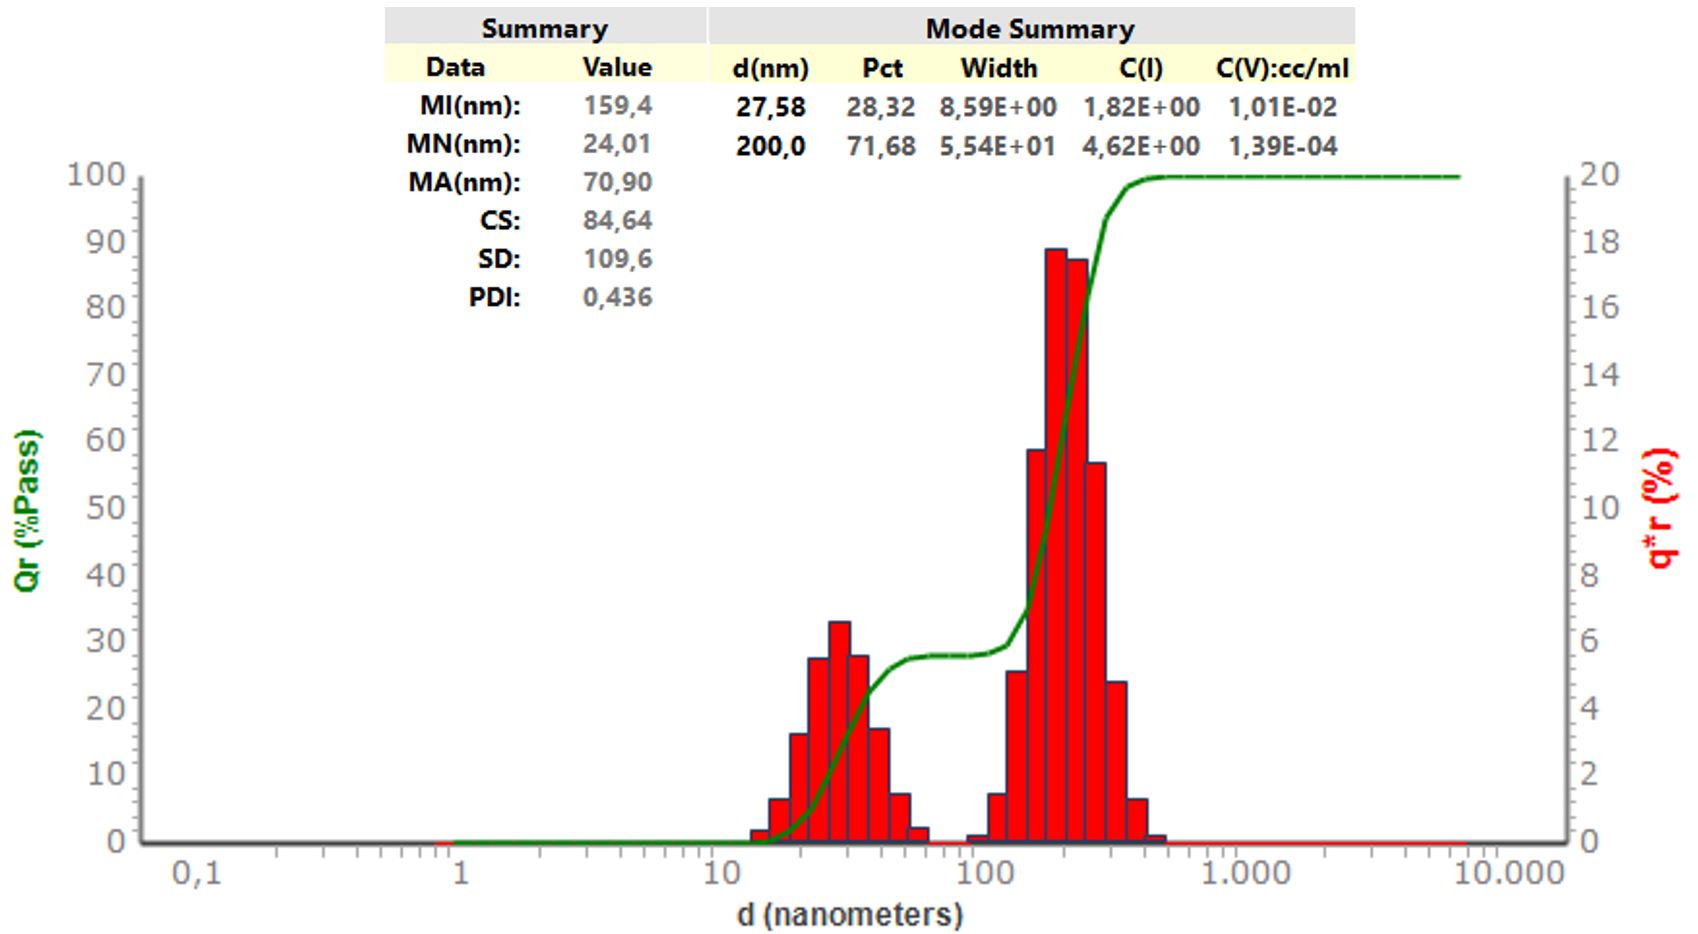
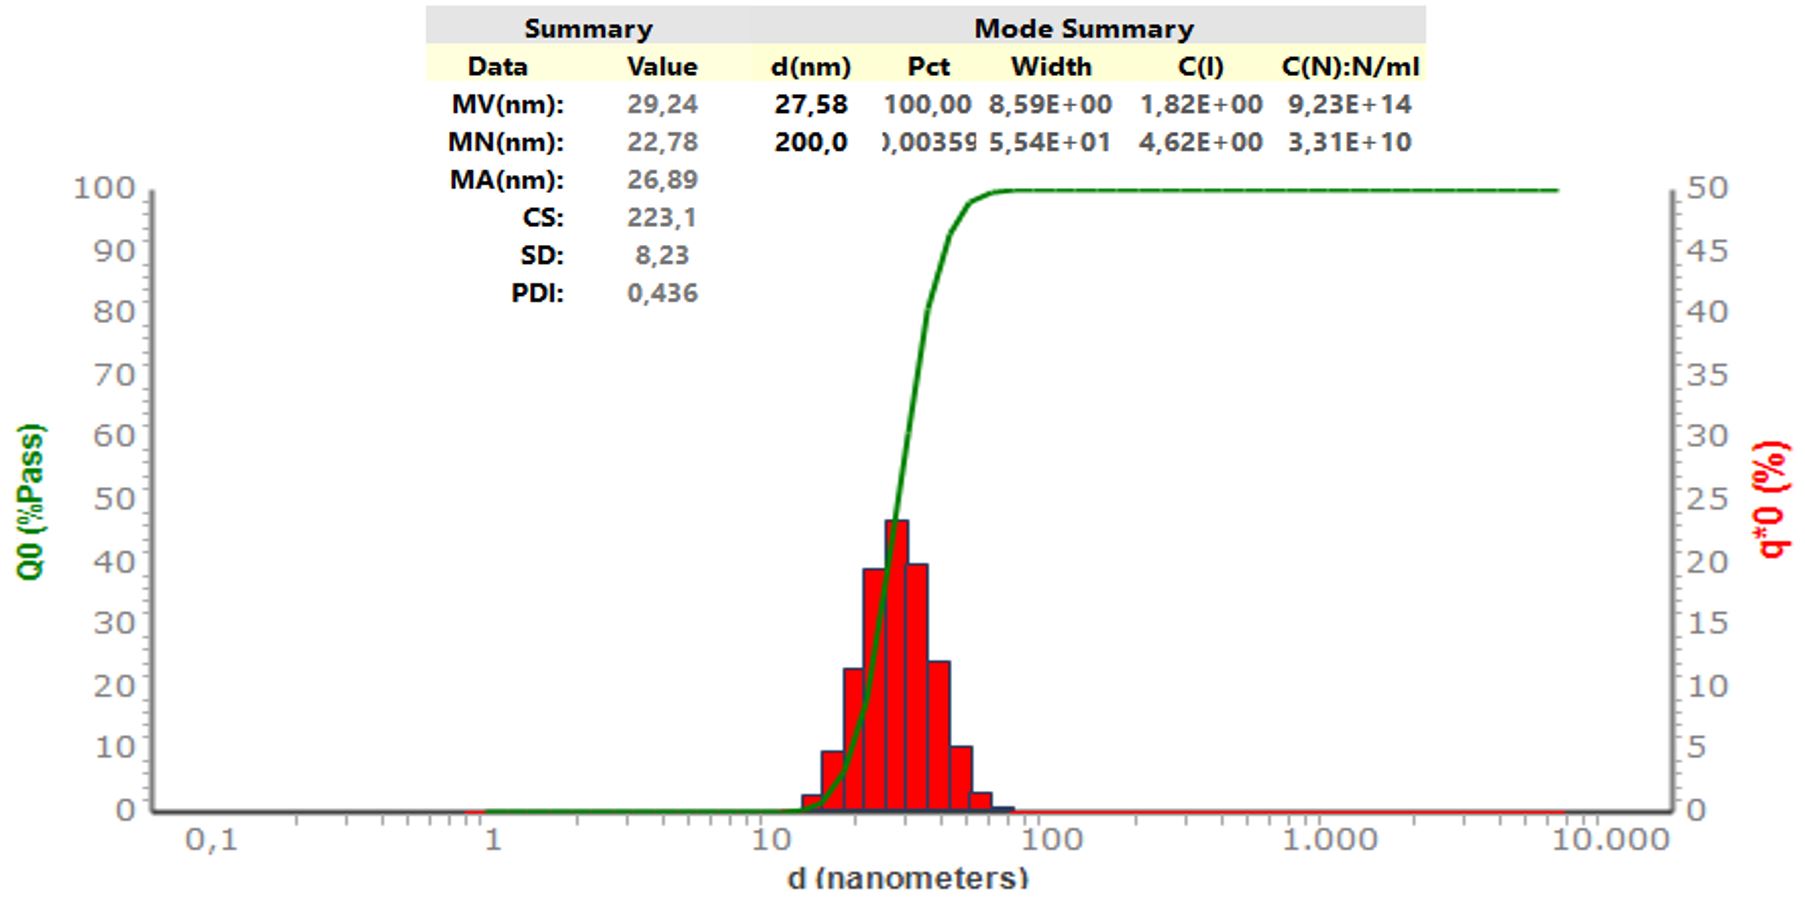
As an example for the described measurement of particle concentration, the particle size distribution of a mix consisting of 30 nm and 200 nm particles is shown below. The chart shows the data and size distribution of the intensity-based plot.
This figure shows the number-weighted particle size distribution, which can be calculated from the intensity-based plot shown in the previous figure. The particle concentration of the 200 nm particles is still output in the number distribution, although the percentage of the total number is so small that it is no longer visible in the distribution curve.
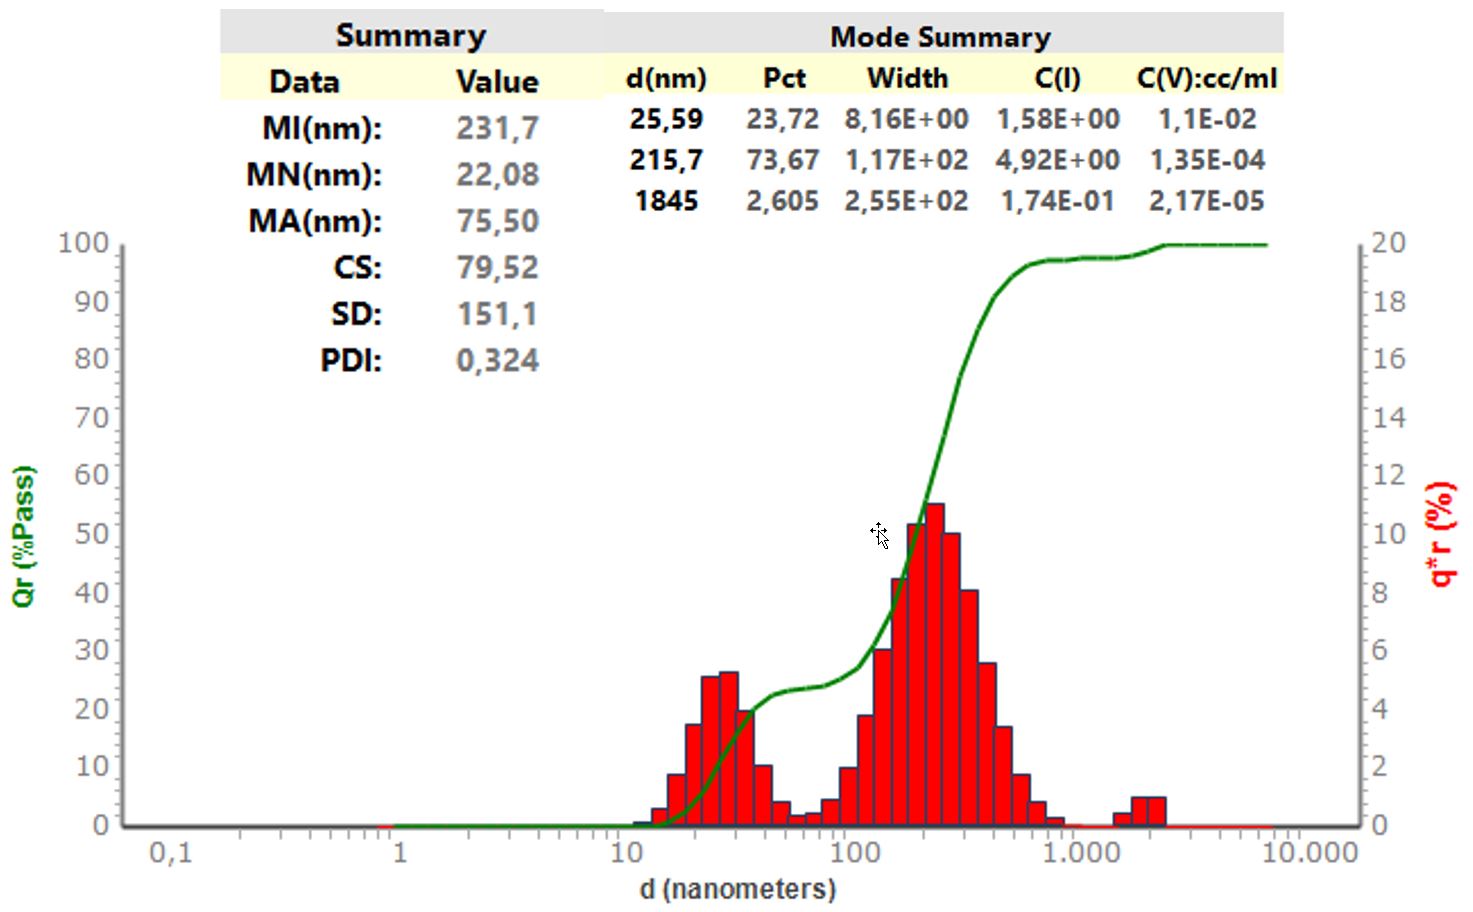
The determination of particle concentration works for monomodal or multimodal size distributions. This figure shows an example of a trimodal sample in the intensity weighted size representation. It consists of three fractions of 26 nm, 216 nm and 1.8 µm.
The concentration of the 200 nm fraction remains constant with 1.39∙10-4 cc/ml and 1.34∙10-4 cc/ml, because only a 2 µm standard was added to the first bimodal sample. The concentration of the 30 nm fraction also remains constant with 1.01∙10-2 cc/ml and 1.10∙10-2 cc/m
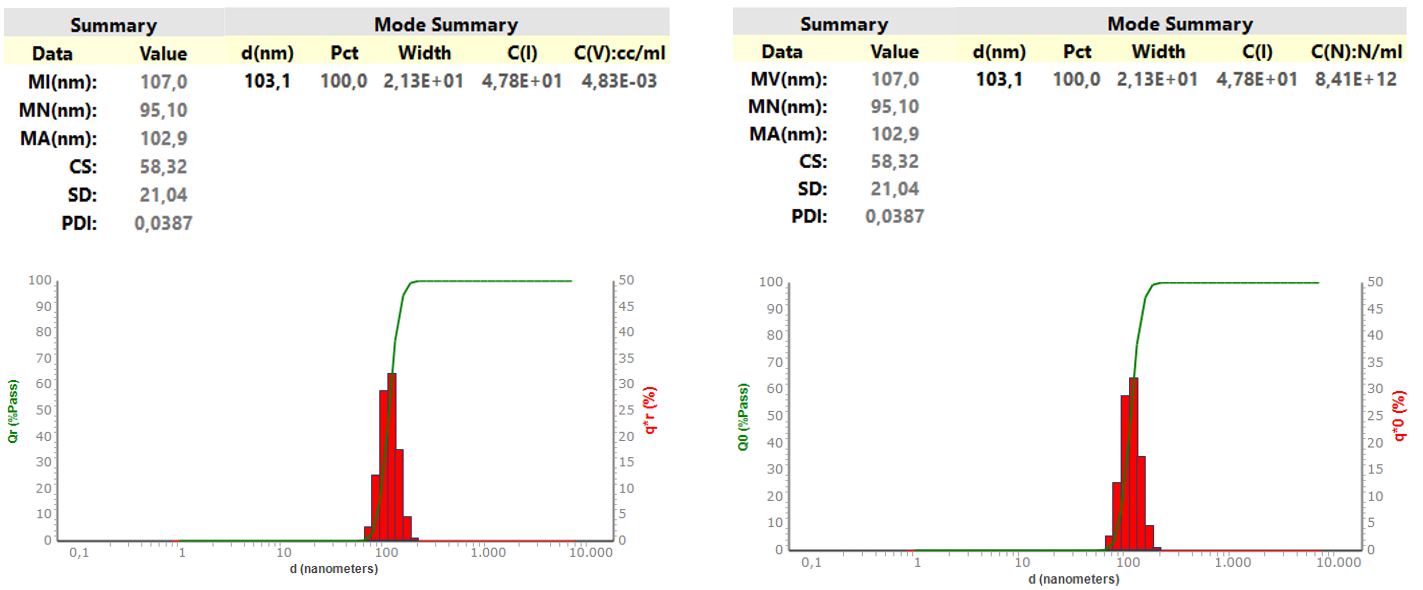
These charts show the particle concentration and size distribution in intensity and number of a 100 nm standard as the simplest example.
Use of the NANOTRAC series analyzers
With the Nanotrac series, in addition particle size analysis, the particle concentration of a dispersion or emulsion can be calculated from the same measurement run, providing additional information about the sample which is useful for many applications. This is possible due to the unique optical design and the use of the power spectrum by a Fast Fourier Transformation.
Contact us for a free consultation
Ultimately, the choice of whether to use a simple sieving solution or to invest in Laser Diffraction or Dynamic Image Analysis will depend on the volume of testing, the budgets and staffing available and any specific international standards or customer requirements that you face.
Why not contact Microtrac for a free consultation to find out which solution will deliver the outcome and the Return on Investment you need?