


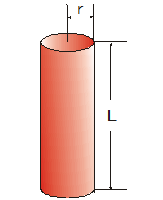
In case of the example of cylindrical pore with the radius r and length L, the pore surface area and volume are calculated from the following equations:
Cylindrical pore

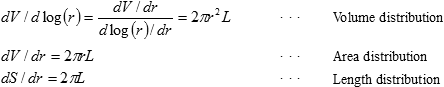
Differential values are expressed as follows:
The following graphs are the examples of BJH analysis of BAM-PM-103 reference material obtained from the nitrogen gas adsorption isotherm.
Pore length distribution
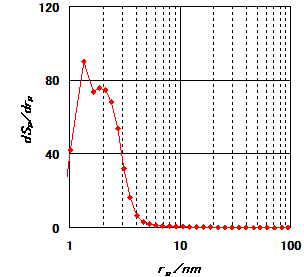
Pore surface area distribution
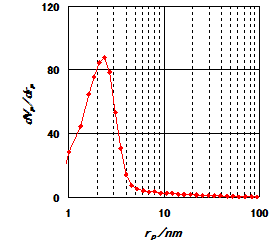
Pore volume distribution
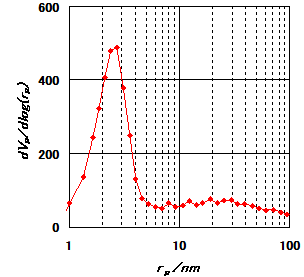
They look quite different, but mathematically, the length distribution has more weight on smaller pores and volume distribution has more weight on larger pores. Conventionally, the gas adsorption uses the area distribution and mercury porosimetry uses the volume distribution. This difference comes from the fact that the gas adsorption is useful to determine the surface area and mercury porosimetry is useful to determine the pore volume. Recent analysis software has a function to switch these distributions, and it is possible to select them depending on the research. The volume distribution is suitable for the research of adsorbent and evaluation of adsorption capacity during the adsorption process.
The area distribution is useful for comparing the area of reactive sites on the catalyst or during the reaction process. The length distribution is suitable for the evaluation of pore depth.
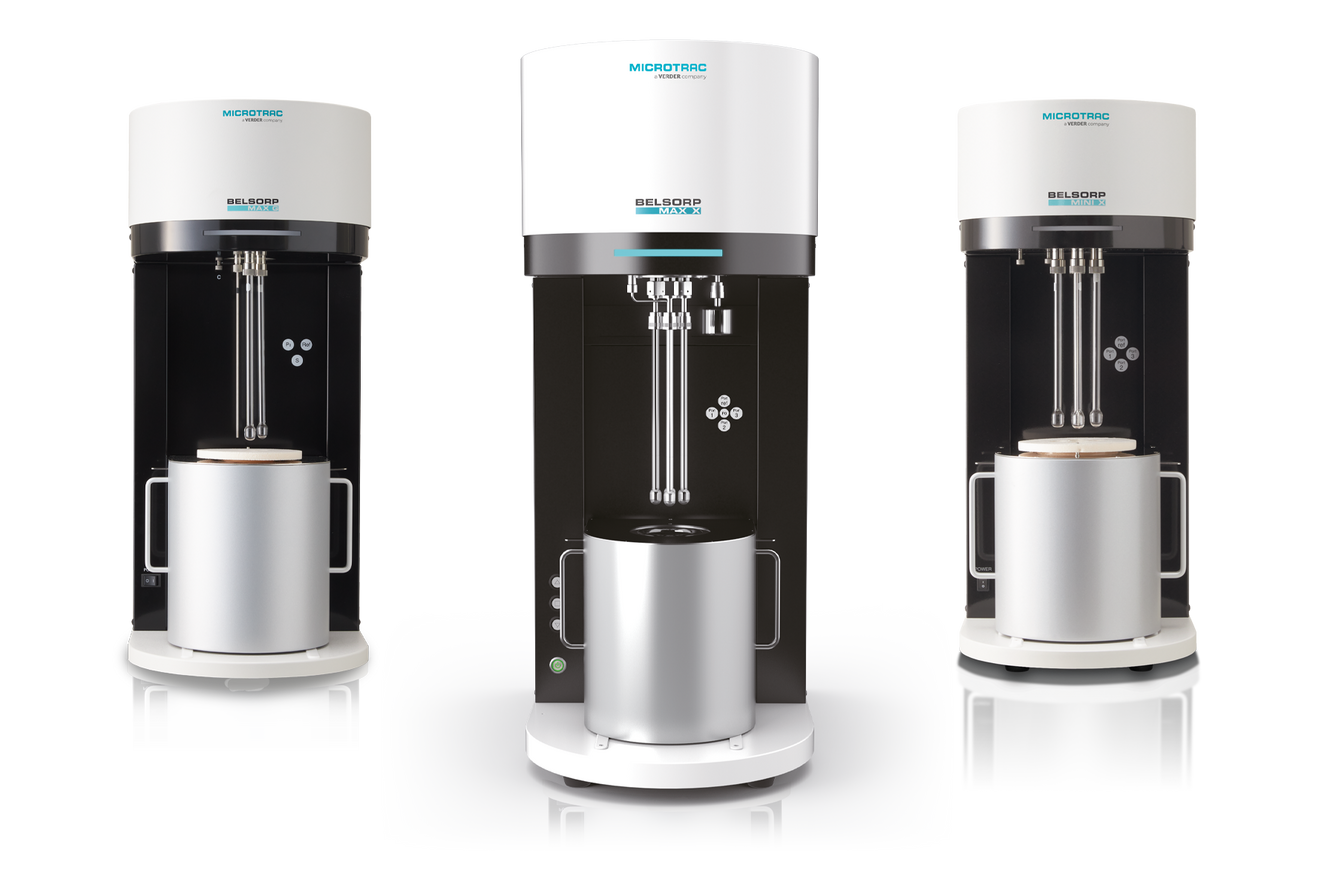
Microtrac offers a wide range of instruments for Gas Adsorption Measurement.
Contact us for a free consultation
Ultimately, the choice of whether to use a simple sieving solution or to invest in Laser Diffraction or Dynamic Image Analysis will depend on the volume of testing, the budgets and staffing available and any specific international standards or customer requirements that you face.
Why not contact Microtrac for a free consultation to find out which solution will deliver the outcome and the Return on Investment you need?